Adapt Progress Evolve · The Work Quarter · Plot 22
Chartsmade
Live · Open premises, lights on · Plot 22, the Work Quarter
Turns a table, a CSV or Excel file, a Google Sheet or a sentence into a finished chart you can embed or download. Part of Look Good Tools, free to start with no account needed.
The story
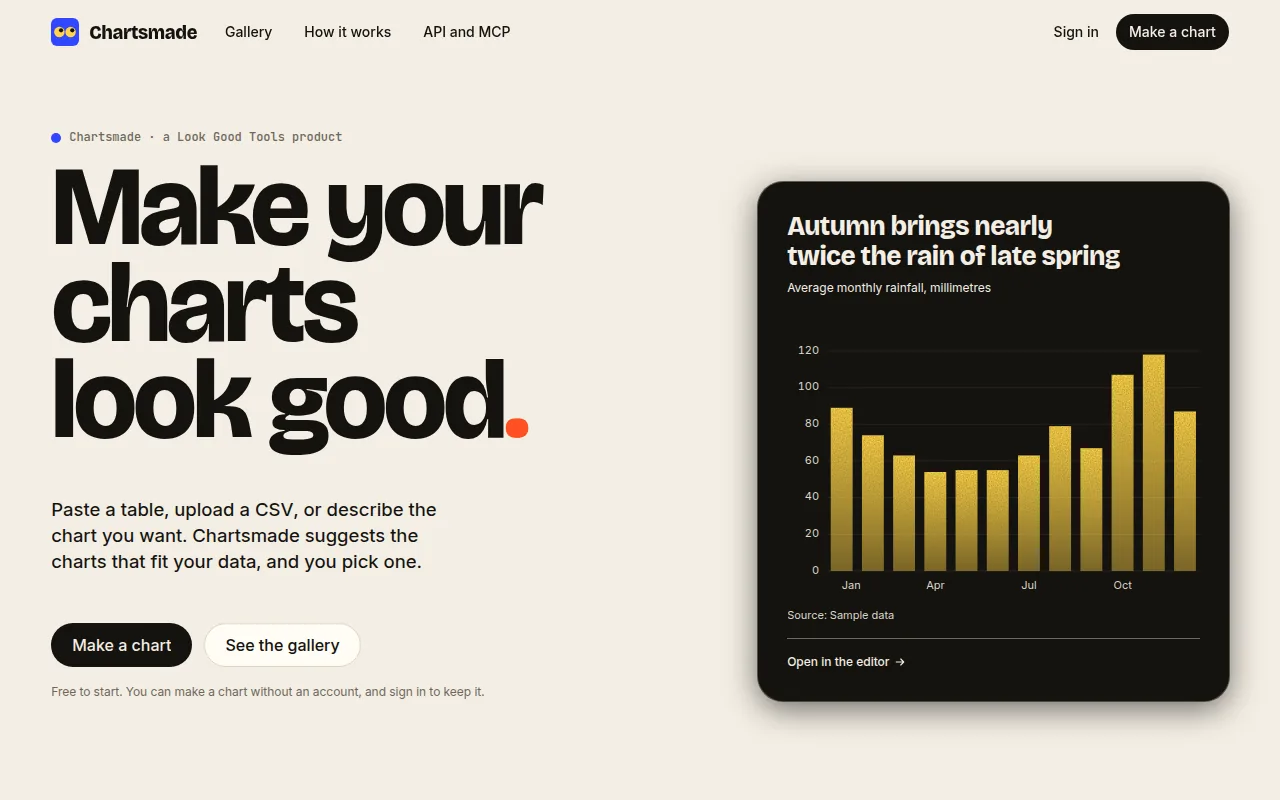
Chartsmade turns a table, a CSV or Excel file, a link to a CSV or a published Google Sheet, or a sentence into a finished chart. You share it as a live embed that sizes itself, or download it as a PNG or SVG. It is part of Look Good Tools, the studio's family of tools for making your work look good.
Who it is for. Anyone with numbers and no patience for fiddling with them: someone writing a report or a slide, or a developer who wants charts from an API. You can make a chart without an account.
How it works in practice. Paste your data and the editor shows what it read. Chartsmade then suggests the charts that fit, and you pick one and set the style, theme, brand kit and words. Headlines are written from your numbers. Saving gives you a link, an iframe and an oEmbed URL, and every embed carries its data table for screen readers. A chart can also keep a link to a CSV, JSON or published Google Sheet and read it again hourly or daily.
What makes it different. There are 18 chart kinds, from lines and bars to waterfalls, candlesticks, sankeys and ridgelines, in five styles and six download sizes. A gallery of 29 sample charts, drawn from sample data by the same engine, opens in the editor. It also has a REST API and an MCP server, so other tools and assistants can make charts too.
Where it stands now. Live and free to start. Charts made without an account are kept for 30 days, and signing in with a Look Good Tools account keeps them. One plan and one credit wallet cover Chartsmade and Decksmade: Free is £0 with basic charts and house branding, and Pro is £29 a month including VAT, with unlimited charts, your own brand kits and no badge.
What it deliberately does not do. It does not ask you to sign up before your first chart. It does not draw anything until you have seen what it read from your data. It does not hide its sample data: the gallery says its charts are samples.
What it does
- 18 chart kinds, 5 styles, 6 download sizes
- Paste, upload a CSV or Excel file, link a Sheet, or describe it
- Live embeds that size themselves, plus PNG and SVG
- Gallery of 29 sample charts, each opens in the editor
- REST API and MCP server
- Free to start; Pro £29 a month across Look Good Tools
Next door in the Work Quarter
Decksmade
Plot 23 · Live
Turns a report, a spreadsheet or an old deck into a designed presentation. Every number on a slide is read from your file, and you check each one before the deck is built.
Seracu
Plot 24 · Live
Finds the searches your website is missing and writes finished articles for them in your own voice, every factual claim traced to a page we fetched. Free check first; paid from £99 one-off.
Forematter
Plot 25 · In development
Onboarding and company-knowledge software for UK companies. It answers only from approved documents, shows the source and owner, and paces a new starter's first weeks. In development.