Adapt Progress Evolve · All work
Live · The Observatory
Cortex Map
A dome for looking at a mind: every memory a star, every strong connection a trail of light.
An open-source, MIT-licensed 3D knowledge-graph component for React, built on Three.js. Bring your own nodes and edges and it renders them as a glowing "war-table" memory map.
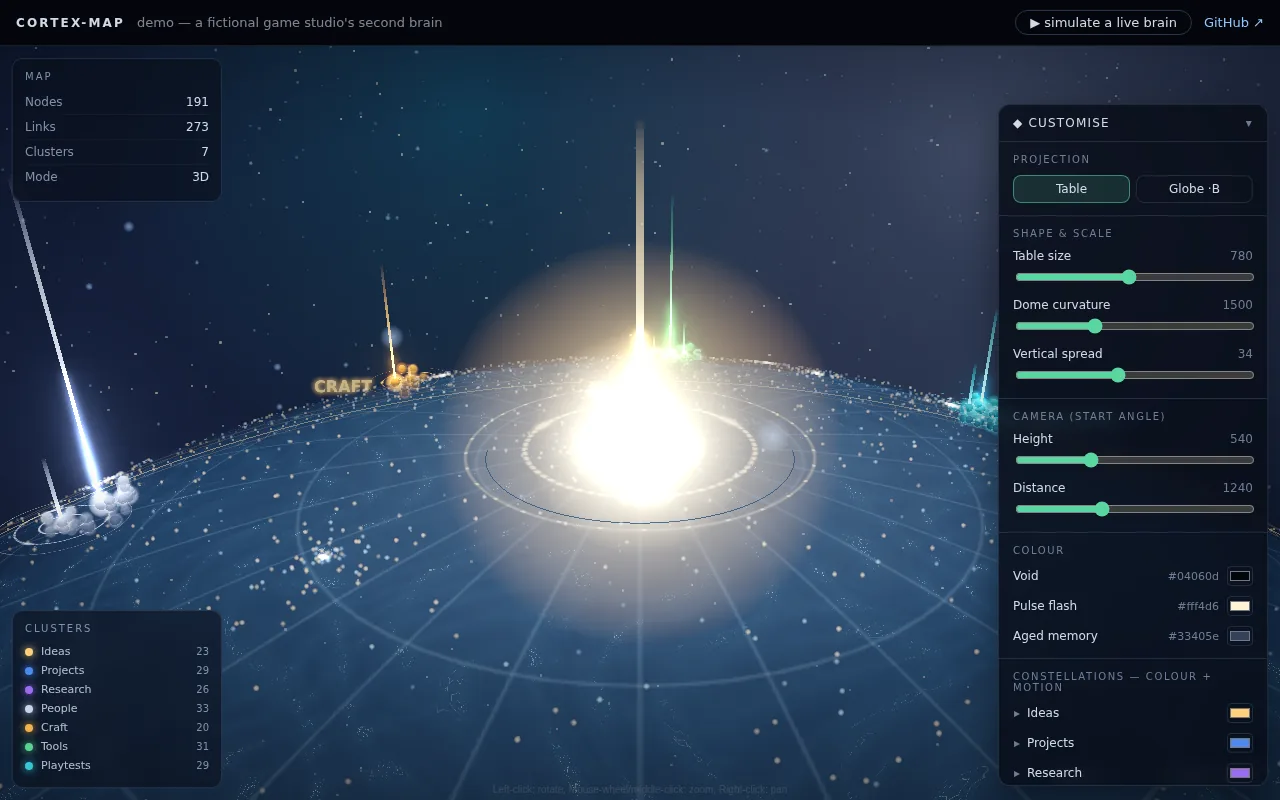
Look through the telescope
The live Cortex Map demo, opened inside the Observatory when you ask for it. Its data is a fictional game studio's second brain, made up for the demo, so nothing in it is anyone's real memory.
Demo data: a fictional game studio's second brain.
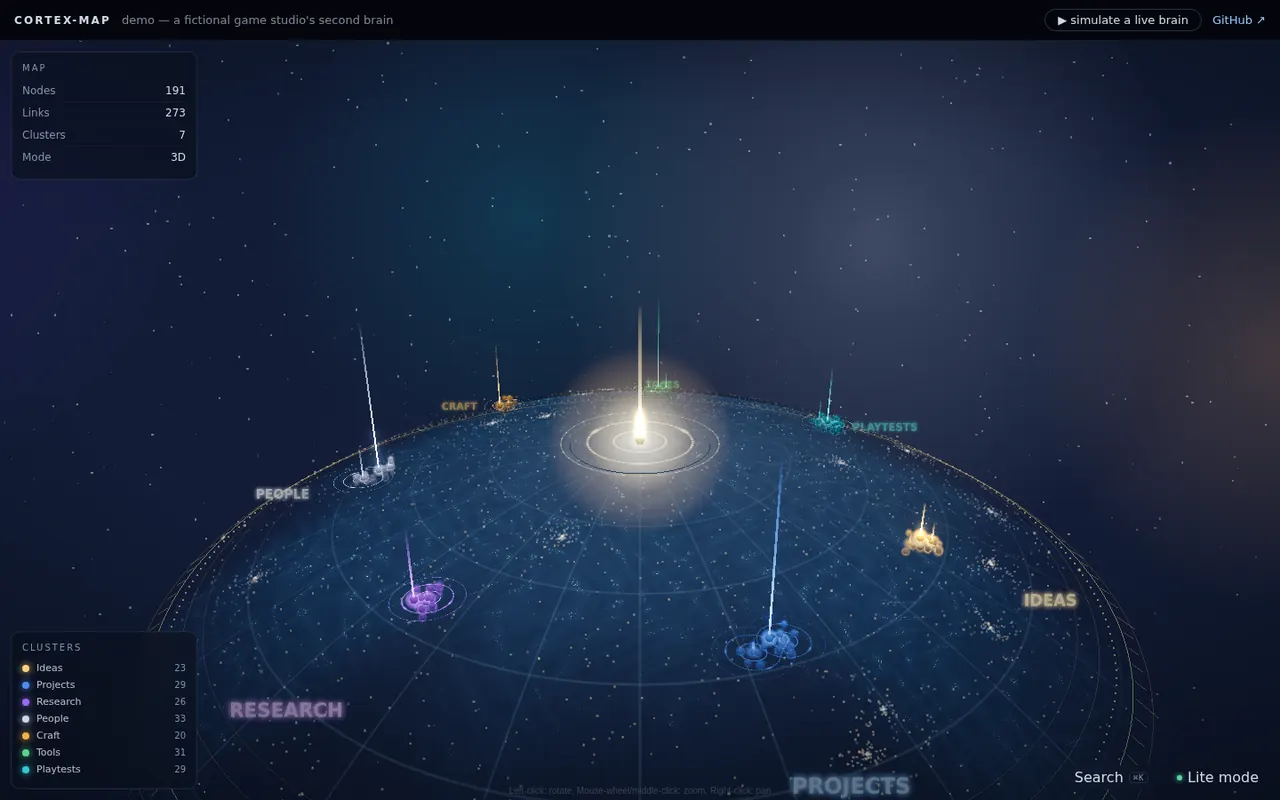
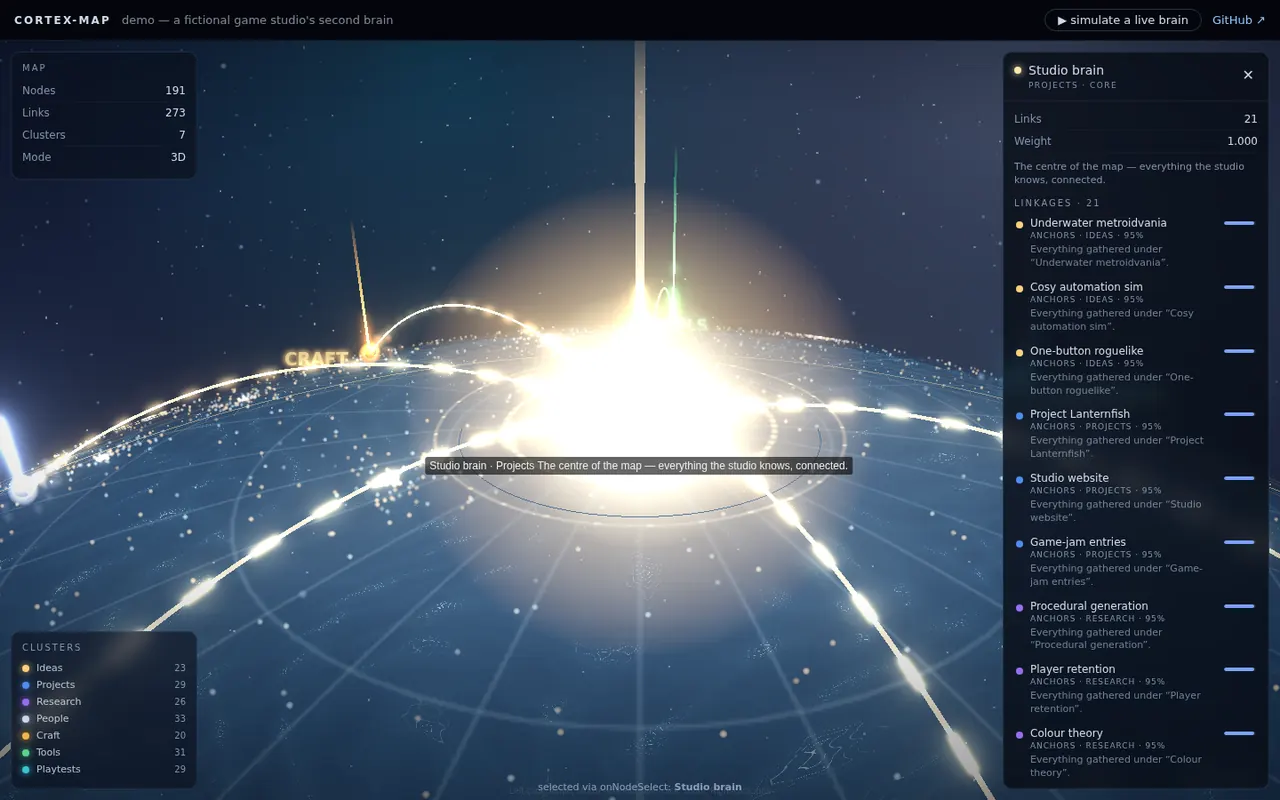
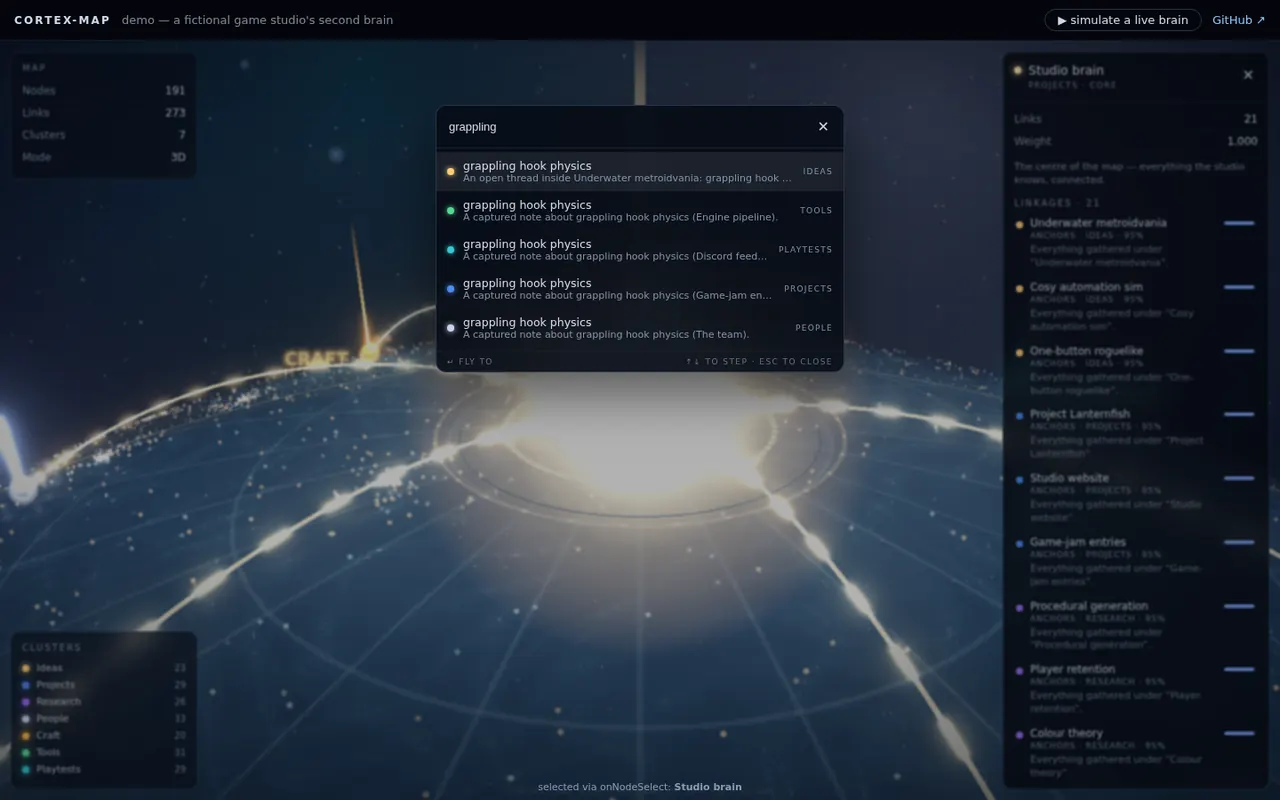
Until you open it, these are stills from the Cortex Map README. The live demo is a full 3D scene, so it loads only when you ask, and it runs best on a larger screen.
The case
The problem
Jarvis, the studio's AI assistant, keeps what it knows in one persistent memory graph that its agents read and write. A graph that size is hard to take in as rows in a table.
The approach
Cortex Map turns nodes and edges into constellations on a holographic table. Each cluster owns a sector, important nodes tower as light pillars, and strong connections arc across the map as particle trails. Click an orb and tentacles reach out to everything it's connected to.
The layout is deterministic: the same data always renders the same map, so it becomes a place you learn your way around.
The finished product
Cortex Map is a 3D knowledge-graph component for React, built on Three.js and released on GitHub under the MIT licence. You bring your own nodes and edges. It has a node inspector, ⌘K search and a flat 2D mode for low-power devices, and the whole look is themeable.
A hosted version is only an idea so far. To register interest, add a thumbs-up on the GitHub issue.
The full write-up
Cortex Map is a 3D knowledge-graph component for React, built on Three.js. You bring your own nodes and edges, and your data turns into glowing constellations. Clusters own their sectors, so related stuff sits together. Important nodes tower as light pillars, and strong connections arc across the map as particle trails. It's a "war-table" for memory, basically.
We built it to visualise the memory of Jarvis, our AI assistant, then released it on GitHub under the MIT licence. The live demo at cortex-map.pages.dev renders a fictional game studio's "second brain", so you can poke around a full map without wiring up anything yourself. A hosted version is waitlist-first, and you can register interest on the GitHub issue.
Who it is for. If you've got a graph in a database and no good way to look at it, this is for you. React developers, mostly. People with memories, notes, agents or entities that link to each other, where a table of rows tells you nothing and a force-directed hairball tells you less. The problem is plain: you can't see the shape of what you know. So you guess. Cortex Map lets you see it instead.
How it works. You hand it nodes and edges, and the library does the rest. Every node becomes an orb, every cluster claims a sector of the table, and the important ones throw up pillars of light. Click an orb and the rest of the map dims while its links reach out, listed in the inspector by strength. Click twice and the camera swoops down. Press / to search, L to simulate a brain at work, G for the globe. Want different colours or dome curvature? The theming panel copies your settings as props to paste.
What makes it different. Most graph viewers treat a graph as a diagram. This one treats it as a place. Age shows up as temperature, with fresh memories glowing in their cluster's colour and riding proud of the surface, while old ones cool to slate and settle in. Busy sectors ripple, then storm. That's a choice, not a law. A place is slower to read than a tidy chart, and some people will want the chart. We'd rather you could walk around the data.
Where it stands. It's small. Around 2,800 lines of code, React plus three.js, MIT-licensed, and first shipped as v0.1.0 on 15 July 2026. It was lifted out of our AI assistant's dashboard into its own public repository with its own data contract, so it draws whatever you give it and none of the assistant comes along. The globe projection is still marked β. The demo runs on fictional data, a game studio's second brain with 191 memories, 273 links and seven clusters, generated from a fixed seed so it's the same on every load.
What it deliberately doesn't do. It doesn't ship with your data, and it doesn't bring ours. None of Jarvis's real memories are in the demo. On a phone, or with reduced motion switched on, it opens as a flat 2D map, because 3D on a small screen is mostly a way to annoy people. There's a kiosk mode for unattended screens, with no links out. For now the library is the product.
What it does
- Bring your own nodes and edges
- Clusters own their sectors, keeping related nodes together
- Important nodes tower as light pillars
- Strong connections arc across as particle trails
- Node inspector plus ⌘K search
- Table or globe projection, fully themeable, MIT-licensed on GitHub
More from Cortex Map
More ventures
Jarvis
In development
Our AI chief of staff: a voice-first assistant backed by a fleet of specialised Claude agents. It's how the studio runs, not a product for sale, and its architecture is public on GitHub.
Jarvising
Live
An open portfolio of test projects, experiments and tools, each with the live piece, how it was made and a recipe for making your own. Four entries: Enigma, Cortex, Inside the Rig and Below the Layer.
Brands over time
Live
A free look at how 172 UK brands write, measured sentence by sentence across their own posts, press releases and homepages. Before and after ChatGPT, against their sector, with every number showing its page count.